Author: Bernt Arne Bertheussen
School of Business and Economics, UiT – The Arctic University of Norway, Tromsø
Økonomisk fiskeriforskning, 34:1-2025, pp. 1-22
Referanse: Bertheussen, B.A. (2025), Økonomisk fiskeriforskning, 34:1-2025, pp. 1-22
Abscract
This study investigates the economic trajectory of a small Norwegian fishing vessel company (the exit firm; EF) operating in an Individual Transferable Quota (ITQ) regulated fishery over 24 years, culminating in its sale. The paper addresses three research questions: investment and financing strategies, financial performance, and factors influencing the exit’s timing. The study shows that EF’s conservative investment and financing strategies contrast sharply with the industry average (the average firm; AF), which was more aggressive in quota, vessel, and gear investments. Despite this, EF performs at least as well as AF in key financial metrics. This finding challenges the conventional expectation that a firm exiting an ITQ industry does so primarily due to poor financial or operational performance. Instead, other factors—such as regulatory rules, ownership age, vessel age, generational considerations, and a strategic exit opportunity—may have played a more significant role in EF’s decision to leave the industry at the chosen time. The paper ends by discussing the findings and their implications.
Sammendrag på norsk
Denne studien undersøker den økonomiske utviklingen til et lite norsk pelagisk rederi (exit-firmaet; EF) som opererte i et system med individuelt omsettelige kvoter (ITQ) over en periode på 24 år. Til slutt valgte rederne å selge selskapet med kvoter. Artikkelen forsøker å svare på tre forskningsspørsmål: 1) hvilke investerings- og finansieringsstrategier fulgte rederiet, 2) hvor godt presterte rederiet økonomisk og 3) hvilke faktorer kan ha påvirket beslutningen om å «kaste inn årene». Studien viser at EFs konservative investerings- og finansierings-strategier står i sterk kontrast til bransjegjennomsnittet (gjennomsnittsfirmaet; AF), som investerte mer agg-ressivt både i kvoter, fartøy og redskap. Til tross for dette presterte EF minst like godt som AF på sentrale finansielle mål. Dette funnet utfordrer den konvensjonelle forventningen om at en bedrift som forlater en ITQ-regulert industri, primært gjør dette på grunn av dårlige økonomiske prestasjoner. I stedet kan andre faktorer – som regulatoriske regler, eiernes alder, fartøyets alder, generasjonsskifte og en strategisk exit-mulighet – ha spilt en mer avgjørende rolle i EFs beslutning om å forlate bransjen på det valgte tidspunktet. Artikkelen avsluttes med en diskusjon av funnene og mulige implikasjoner av disse.
Keywords: ITQ fishery, exit strategy, exit timing, vessel’s financial performance
Innhold
Introduction
ITQ systems are designed to promote sustainable fishing practices and economic efficiency (see, e.g., Arnason, 2008; Grafton, 1996, 2005; Grafton et al., 2006). Extensive research has been conducted on the profitability of vessels participating in ITQ fisheries (see, e.g., Bertheussen & Vassdal, 2023, 2021, 2019; Bertheussen, 2021; Flaaten et al., 2017; Hannesson, 2013) and the investment behavior of the Norwegian pelagic fishing fleet has been studied thoroughly (Abe et al., 2023; Bertheussen et al., 2020; Hannevig & Bertheussen, 2020; Nøstbakken et al., 2011; Nøstbakken, 2012).
Also, market entry, often referred to as the threat of new entrants, has been the subject of research (Bertheussen et al., 2021). However, the theoretical and empirical foundation for exit strategies in ITQ-regulated fisheries remains considerably less developed (Park & Jang, 2009; Vestergaard et al., 2005). However, understanding exit strategies is equally vital for a balanced view of market dynamics. Entry and exit behaviors collectively determine the number of active participants in the fishery, affecting competition, quota prices, and the industry’s overall financial health (Porter, 2008).
Fisheries are subject to environmental fluctuations and regulatory changes (Vatn, 2007). How participants choose to exit in response to these changes can provide insights into the adaptability and resilience of the fishery under different scenarios. Understanding why and how fishery participants exit can inform policymakers and managers in refining ITQ systems and other regulatory mechanisms. This knowledge can help design policies that ensure a fishery’s long-term sustainability (Asche et al., 2018). Psychological factors like risk tolerance and decision-making biases may also influence exit strategies. Exploring these aspects can contribute to the broader field of behavioral economics (Nøstbakken et al., 2011; Nøstbakken, 2012).
In summary, a study on exit strategies in ITQ fisheries could fill a crucial gap in understanding the complete economic lifecycle of fishery participation. Understanding exit strategies is essential to assess how well the goals of ITQ systems are met. If exit strategies are inefficient or problematic, it could indicate underlying issues in the economic viability of the fisheries management system.
The following research and research sub-questions are raised in this study:
The present study focuses on a specific firm in the Norwegian pelagic harvesting industry, “the exiting firm,” hereafter abbreviated EF, and its economic behavior before exiting the industry. EF’s strategic choices and outcomes are compared to those of an industry-average firm, the AF. To my knowledge, this study represents a rare longitudinal empirical investigation rigorously assessing the disinvestment behavior of a Norwegian fishing boat firm holding a valuable pelagic quota. The analysis spans from the initial quota allocation at no cost through the years of active utilization to its ultimate sale. A focal point of this research is the detailed examination and analysis of the exit strategies employed by the quota seller. Thus, hopefully, this study will contribute to the literature on exit strategies of fishing vessel firms, enhancing our understanding of the dynamics involved.
- RQ 1: How did the investment and financing strategies of the exiting firm (EF) differ from those of the average industry firm (AF) throughout the study period?
- RQ 1a: Did EF invest less in quotas than AF?
- RQ 2b: Did EF replace its vessel as frequently as AF?
- RQ 2: How did the operational performance of EF compare to AF in the years leading up to the industry exit?
- RQ 2a: Did EF have lower profitability than AF?
- RQ 2b: Did EF have lower profitability AF?
- RQ 3: Which factors may have influenced the timing of the exit?
The paper proceeds as follows. The following section provides a literature review of exiting strategies in small family businesses. A chapter follows on how institutions can influence the competitive dynamics within Norway’s pelagic harvesting industry. This analysis will explore the implications of these institutional impacts on the financial performance of firms, which in turn is directly mirrored in the valuation of their quota holdings. The paper then briefly examines the industry’s economic performance over the past few decades. This is followed by an outline of the methodology used in the study. Next, the findings are presented and discussed in depth. Finally, the study ends by pointing out its limitations and proposing directions for future research.
Literature on exit strategies in small family businesses
Exit strategies in small family businesses are multifaceted and influenced by financial objectives, emotional ties, and generational considerations (Chirico et al., 2020; Symeonidou et al., 2022). Understanding these strategies requires an examination of both the unique characteristics of family-owned enterprises and the broader market dynamics they navigate (see next chapter).
A critical concept in family business literature is socioemotional wealth (SEW), which encompasses the non-financial aspects of the business that family members value, such as identity, legacy, and emotional attachment. DeTienne and Chirico (2013) argue that SEW significantly influences exit strategies in family firms. Their research suggests that family owners may prioritize the preservation of SEW over financial gains, leading to exit decisions that differ from non-family businesses. For instance, a family might choose to sell the company to a buyer who aligns with their values to ensure the continuation of the family’s legacy, even if it means accepting a lower offer.
Succession planning is a pivotal aspect of exit strategies in family businesses. The process involves preparing the next generation to take over leadership roles, ensuring business continuity. A study by Gilding et al. (2015) highlights that effective succession planning secures the firm’s future and fosters innovation. The study emphasizes the importance of early planning, clear communication, and developing a family constitution to outline roles and responsibilities. Family businesses risk internal conflicts and potential failure during transition without a well-structured succession plan.
Beyond succession, family businesses may consider various exit strategies (De Tienne et al., 2015): Selling to an external buyer can maximize financial returns but may lead to cultural shifts within the company. Owners must weigh the economic benefits against potential company direction and value changes. Another exit strategy involves selling the business to a trust that benefits the employees. This can preserve the company’s legacy and ensure employee welfare. However, the success of this strategy depends on a motivated workforce capable of running the business without the original owner and that they have trust has the required financial means (ibid.). Selling the company to the existing management team is a third exit strategy that can ensure continuity. This requires the team to have sufficient financial resources and managerial expertise to sustain operations.
Despite the availability of various exit options, many small family businesses face challenges when exiting. Owners often have deep emotional ties to their companies, and deciding to exit is difficult (Gilding et al., 2015). This attachment can lead to delays in planning and hinder objective decision-making. A significant number of family businesses lack formal exit or succession plans. This weakness can result in rushed decisions during crises, potentially jeopardizing the business’s future (Hsu et al., 2016).
Economic conditions, industry trends, and regulatory changes can impact the feasibility and timing of exit strategies. Owners must stay informed and adaptable to navigate these external factors effectively.
Market dynamics in an ITQ-regulated fishery industry
Porter’s five forces framework (Porter, 1980, 2008) aims to analyze the competitive dynamics of an industry. It emphasizes that the structure of an industry plays a crucial role in determining incumbent firms’ long-term profit potential. Porter identified five competitive forces that shape industry structure: rivalry among competitors, the bargaining power of suppliers, the bargaining power of buyers, the threat of entry, and the threat of substitutes. He argued that industry structure significantly impacts a firm’s ability to retain profits compared to what is distributed to customers and suppliers or limited by substitutes and potential new entrants.
Porter’s main focus was understanding the relationship between industry structure and firm performance. However, some critics have argued that this approach neglects essential factors such as context, history, and the influence of institutions on firm performance (North, 1990). These critics highlight the need to consider institutions and their impact on industry performance rather than assuming a free market-based institutional framework where laws and regulations are seen as background elements applicable to most industries.
Commercial fish harvesting industries are subject to sector-specific institutional frameworks implemented to avoid overfishing and protect the fishers from devastating internal rivalry (Bertheussen, 2021, 2022a). The specific institutions that impact the fish harvesting industry include TAC regulations, license requirements, and fish quota systems that provide institutional protection of the raw material market share of the fishers (also see Table 1). Furthermore, government policies in Norway favor cooperative fisher-owned sales unions (Hersoug et al., 2015).
These institutions are expected to impact the structure and competitiveness of the fish harvesting industries. A favorable industrial framework can spill over into the firm’s ability to create ongoing returns on fishery operations while simultaneously building up the asset values of quotas.
Table 1 provides an overview of sector-specific institutions expected to impact the structure and competitiveness of the Norwegian pelagic fish harvesting industry.
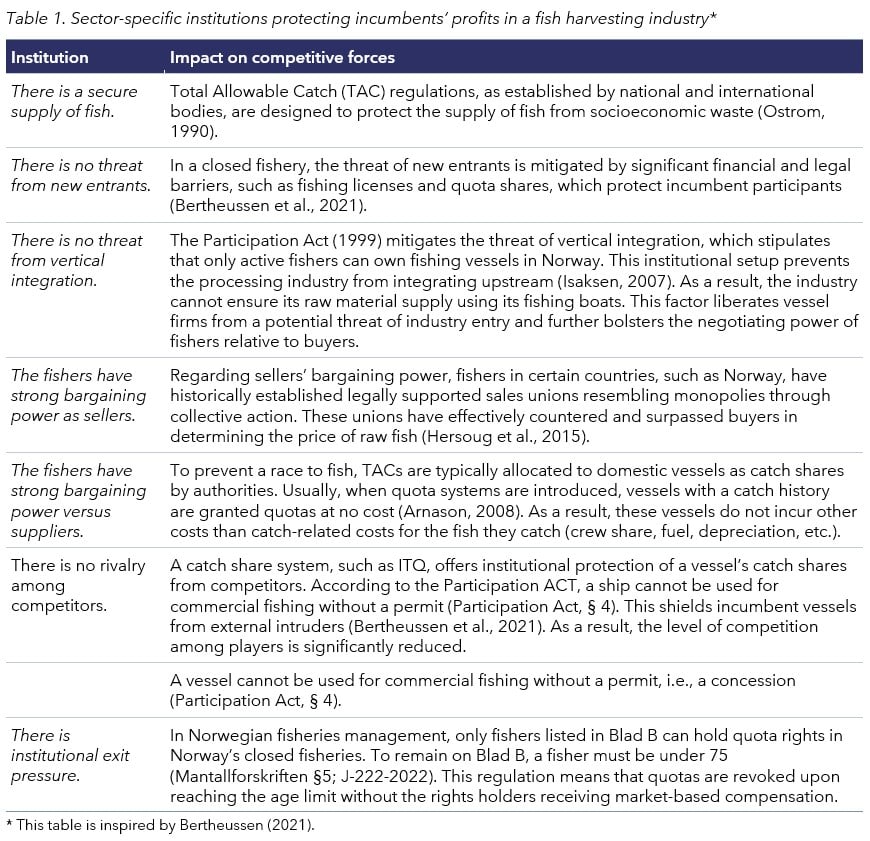
North (1990) and Peng et al. (2009) contend that institutions such as public regulations significantly influence the competitive dynamics within an industry, thereby shaping the profit-making capabilities of incumbent firms. As a result, firms operating within a sector-specific institutional environment are anticipated to demonstrate superior financial performance relative to those in industries governed by a more generalized institutional framework (Bertheussen, 2021; Bertheussen & Vassdal, 2021).
Fish represents an attractive form of seafood, naturally pre-processed by nature itself. Historically, the Norwegian population has collectively owned fish resources, a tradition that continues today (e.g., Arntzen, 2023). However, the act of harvesting has been delegated to professional fishers. Unlike other industries, fishers do not incur costs for the input factor of fish, which is evident in the “cost of goods sold” line item in shipping company’s financial statements. This expense is negligible compared to sales revenue. Operating margins exceeding 30% have not been uncommon among shipping companies in recent years, even after crew members have received an approximately equal share of the turnover as wages (“lott” in Norwegian) (also, see Appendix 3).
The competition among fishers to capture the largest possible share of the total quota has been eliminated through vessel-specific quotas. As a result, the historically intense internal rivalry within the industry has been eradicated. For sound historical reasons, fishers have also established a collective sales organization, which grants them significant bargaining power vis-à-vis fish buyers (Hersoug et al., 2015).
Fishers are also shielded from external entrants through practical barriers to entry (Bertheussen et al., 2021). In addition to legal requirements, a significant financial burden is associated with purchasing vessels and quotas for those wishing to establish themselves as fishing vessel owners. Furthermore, the potential threat from the processing industry to purchase quotas themselves—known as vertical integration—is precluded by legislation (Isaksen, 2007). Another consequence of this regulatory framework is the near absence of new entrants among larger pelagic fishing vessels in the past decades (Bertheussen et al., 2021).
Industry performance
It took approximately twenty-five years for the Norwegian pelagic fishery to recover after the collapse in the early 1970s (Bertheussen, 2022a), that is to say, in the years preceding the commencement of this study. Table 2 indicates that revenue per vessel increased from 7 million NOK in 1985 to 23 million NOK in 1997. Operating profit rose from 0 million to 5 million per vessel during the same period. Meanwhile, the operating margin improved from 2% to 23% per vessel. Concurrently, vessels declined from approximately 140 in 1985 to 100 in 1997 (Bertheussen et al., 2021).
I have not found any empirical studies that systematically examine the characteristics of the exiting vessels in this period. However, after many years of economic hardship for the pelagic fleet due to an overfished herring stock (see, for example, Bertheussen, 2022a, 2022b), the market, through bankruptcies, forced some pelagic vessels out of business. Additionally, actors may have been incentivized to take advantage of public decommissioning schemes designed to reduce excess capacity in the fleet (Flaaten, 2021).
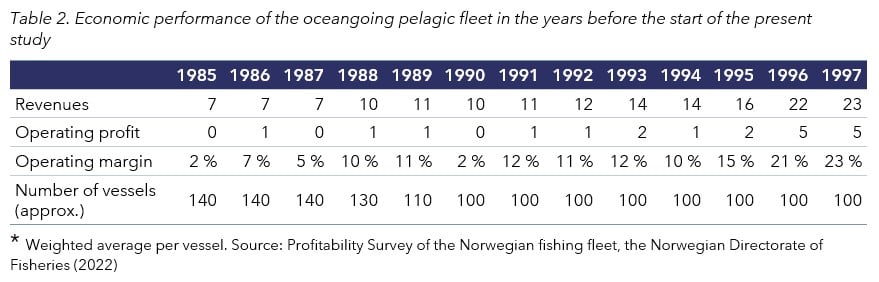
Figure 1 shows the overall catch volume, catch value, and price per kilo development in the Norwegian pelagic fishery during 1998-2021. The total catch value increased from 3.3 billion NOK to 8.5 billion NOK, a 158% increase. This development occurred despite a 36% decrease in catch volume from approximately 2.1 million tons in 1998 to just over 1.3 million tons in 2021. The increase in value is thus due to a 300% rise in the price of pelagic products during the study period. In contrast, the Norwegian Consumer Price Index increased 72% over the same timeframe. A weak Norwegian Krone is relative to the US dollar, and the euro has also contributed to increased vessel revenues in recent years.
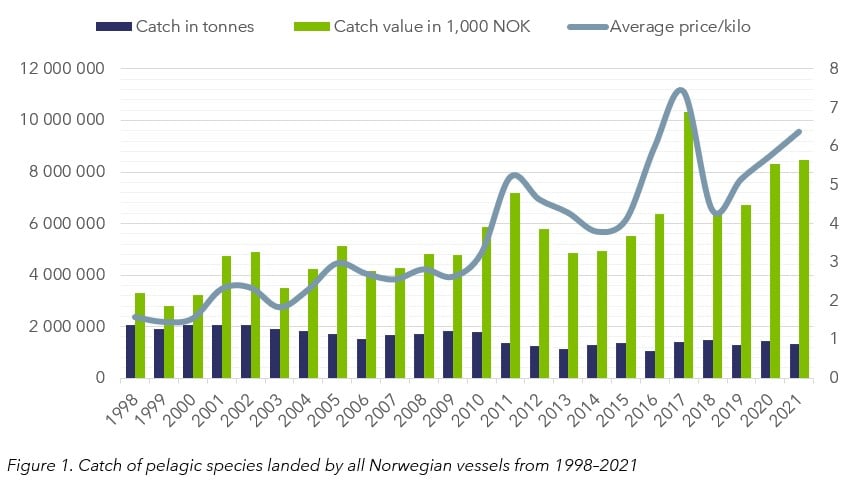
Mackerel is the most valuable pelagic species (accounting for over 50% in 2021), followed by herring (nearly 40%). In 2021, the first-hand value of pelagic fish, demersal fish, and shellfish was 22 billion NOK. Pelagic fish accounted for 39% of Norway’s total first-hand value of wild-caught seafood this year.
The offshore pelagic fleet accounts for approximately 60% of the total catch volume. The dataset includes the following species: Atlantic Mackerel, Atlantic Herring, Blue Whiting, Capelin, Norway Pout, Sand eels, Atlantic Horse Mackerel, European Sprat, and Other Pelagic Species. Left axis: catch volumes in tons and catch value in 1,000 NOK. Right axis: average price per kilo. Source: https://www.fiskeridir.no/Yrkesfiske/Tall-og-analyse/Statistiske-publikasjoner/Noekkeltall-for-de-norske-fiskerienehttps://www.fiskeridir.no/Yrkesfiske/Tall-og-analyse/Statistiske-publikasjoner/Noekkeltall-for-de-norske-fiskeriene
A significant number of studies have examined the profitability of the Norwegian pelagic fish harvesting industries, as evidenced by works such as Bertheussen & Vassdal (2023, 2021, 2019), Bertheussen (2021), Bertheussen et al. (2020), Flaaten et al. (2017), and Hannesson (2013). The Norwegian Directorate of Fisheries also annually publishes profitability surveys for various fleet segments and boat sizes (see fdir.no). The National Audit Office’s examination of the Norwegian quota system also indicates lucrative and increasing profitability in most Norwegian fisheries (NAO, 2020).
Method and data
This study employs a longitudinal, quantitative approach to examine and contrast the investment and disinvestment strategies and economic performance of a purse-seine fishing vessel nearing the end of its operational lifecycle with a representative sample of ships from the broader industry. Within this industry benchmark group, most vessels are at varying lifecycle stages compared to the boats phasing out. The industry landscape is diverse: some vessels are scaling their operations by acquiring additional quotas, necessitating investment in larger boats to handle increased catch capacity. Others maintain their current quota allocations but are compelled to invest in new vessels as their existing ones approach the end of their economic viability. A smaller subset of vessels refrains from further investment in quotas or new boats as they intend to exit the fishery, adopting an exit-oriented business strategy.(Hannevig & Bertheussen, 2020)
Sample and data collection
This study covers 24 years, from 1998 to 2021. It began just two years after Norway introduced transferable quotas (Hersoug, 2005) and after governmental support for Norwegian fisheries had been reduced to a minimum (Flaaten, 2021). The final year of the study is particularly significant, as it marks the year immediately preceding the sale and subsequent exit of the exit firm (EF) from the fishery.
The data about the company under investigation is derived from audited annual financial statements, which are publicly accessible and deemed reliable sources of economic information. Additionally, details about the vessel’s quota composition and size are publicly available, as they are published by the Norwegian Directorate of Fisheries (2023). Notably, Norway lacks a formal public registry that tracks the trading of fishing quotas (NAO, 2020). Consequently, the company’s terminal value upon its sale was sourced from an article by journalist Engø (2022, 2023) in the online magazine Kystmagasinet (The Coastal Magazine), which reported a company sale value of 478 MNOK. According to Kystmagasinet, the buyer explicitly stated this valuation in their application to Norwegian authorities for acquisition approval. For this dataset, the sale amount is incorporated into the company’s final fiscal year, 2021, despite the transaction taking place a few months into 2022.
While fishery management’s primary goals often encompass improving economic performance, there is frequently no data on vessel profitability to assess this metric adequately. This shortfall is generally attributable to the sporadic collection of such data or its limited scope across various fisheries (Pascoe et al., 2019). In contrast, the Norwegian Directorate of Fisheries (2023) mandates the annual submission of detailed income and cost data for most fishing vessels, providing a more comprehensive dataset for analysis.
The financial information for the industry is based on weighted average figures that the Norwegian Directorate of Fisheries has collected from a sample of companies in the industry as part of its annual profitability survey of the Norwegian fishing fleet. These surveys are publicly available with summaries in English (Norwegian Directorate of Fisheries, Profitability survey of the Norwegian fishing fleet, n.d.).
The sample of vessels constitutes 70-80% of the total population. Companies that are excluded from the survey are considered to be non-representative.
Units of analysis
In the profitability surveys conducted by the Norwegian Directorate of Fisheries (n.d.), the primary unit of analysis is the individual vessel. Conversely, in the public financial statements, the focus shifts to the company as the unit of study. As Vassdal & Bertheussen (2020) highlighted, these units are not inherently comparable. A company may engage in vertical or horizontal integration with other business segments. In such instances, the consolidated financial statements could encapsulate the economic performance and status of the entire business conglomerate. However, the case company (EF) in the present study is streamlined, consisting solely of one strategic business unit focused on fishing operations. As a result, the financial statements of the case company closely mirror those of a single-vessel account, rendering a comparison of the units of analysis in this study both relevant and meaningful. This argument gains additional credence from the characteristic low ownership concentration within the purse seine vessel group; independent shipowners own most of these vessels, which is a requirement under the Participation Act.
Measuring financial performance
Performance is a complex construct that can be evaluated through various metrics, ranging from a firm’s current value creation and profitability to its growth trajectory and market share. Moreover, performance assessment can transcend financial indicators to encompass non-financial objectives (Dreyer & Grønhaug, 2004). This highlights the intricacy of performance measurement and underscores the need for a holistic approach to accurately gauge a firm’s strengths and weaknesses.
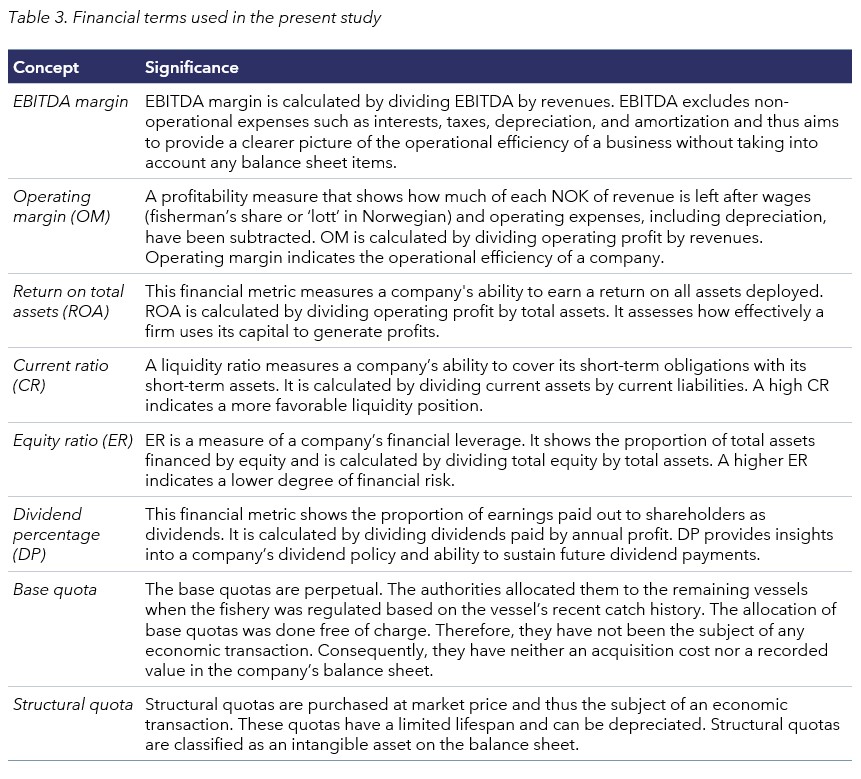
Investment and disinvestment behavior manifest in a company’s balance sheet, while its economic performance is captured in the income statement. Table 3 delineates the business economic metrics utilized in this study for evaluation. By differentiating between balance sheet and income statement metrics, this study facilitates a nuanced understanding of the investment and disinvestment strategies employed and their consequent economic outcomes.
Empirical findings
This section details the empirical results obtained from the current study.
Findings in response to Research Question 1
The first research question and its subquestions were formulated as follows:
- RQ 1: How did the investment and financing strategies of the exiting firm (EF) differ from those of the average industry firm (AF) throughout the study period?
- RQ 1a: Did EF invest more or less in quotas than AF?
- RQ 1b: Did EF invest more or less in vessel and gear than AF?
Comparative analysis of investment strategies
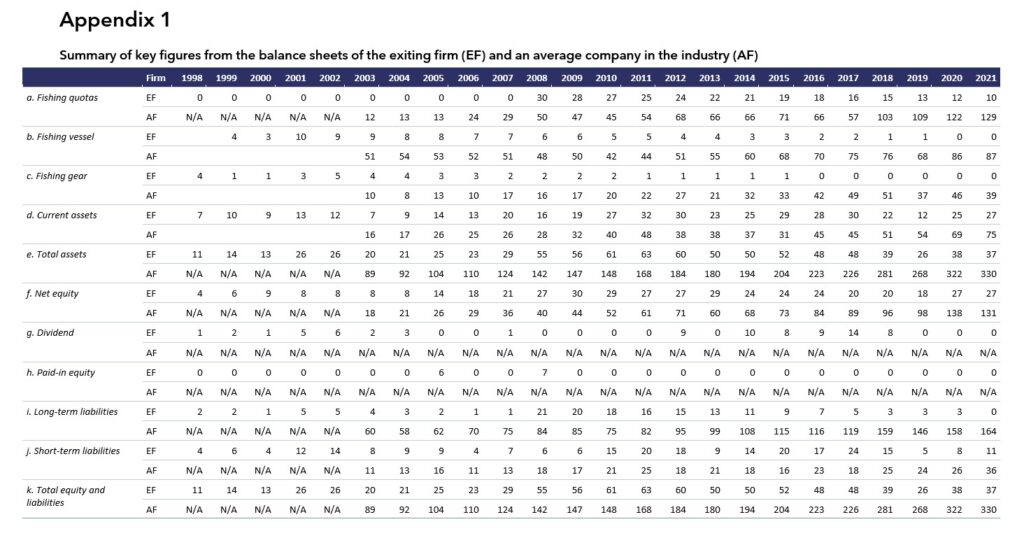
Appendix 1 presents a compilation of key financial metrics from the balance sheets of EF and AF spanning the 24-year study period from 1998 to 2021. Historically, EF predominantly operated on everlasting base quotas, which were initially allocated at no cost upon introducing the vessel quota system (see Appendix 1a). Yet, in 2008, EF augmented its quota holdings by 14%, purchasing 50 base tons of time-limited structural quotas (SQs) for 30 million NOK (refer to Appendix 1a). By 2021, about 66% of these recorded SQs had been written down. In contrast, AF’s recorded quota holdings surged by 158% between 2008 and 2021, thus more than doubling its initial holding. Therefore, in response to RQ 1a, it is reasonable to conclude that EF invested significantly less in quotas than AF.
During the analysis period, EF made negligible investments in the fishing vessel (see Appendix 1b). Initially constructed in 1966 (see Table 5), the ship underwent a significant refurbishment as far back as 1980 (Wisth & Sivertsen, 2023). It has been primarily depreciated throughout the analysis period. The shipping company’s investments in other operational assets, such as fishing gear, have also been modest, especially compared to AF (refer to Appendix 1c). Accordingly, the response to RQ 1b is that EF invested significantly less in its vessel and gear than AF.
Comparative analysis of financing strategies
As detailed in the preceding sections, EF had minimal quotas, vessel, and equipment investments. Consequently, the company only needed to incur long-term debt in association with its quota purchase in 2008 (refer to Appendix 1i). AF’s long-term debt nearly doubled, increasing by 171% during the period data is available from the Norwegian Fisheries Directorate (2022). AF’s net equity rose from 18 MNOK in 2003 to 131 MNOK in 2021. Meanwhile, EF’s net equity surged 230% over the same timeframe (see Appendix 1f). Both AF and EF have accumulated significant current assets during the analysis period (refer to Appendix 1d). In 2021, these accounted for 95% and 80% of the turnover, respectively (Appendix 1d divided by Appendix 2a).
During the analysis period, EF distributed dividends totaling 79 million (refer to Appendix 2d). This amounts to an average of 3.3 MNOK annually. The average dividend rate stands at 56% of the annual profit. Dividend payouts were particularly high in the years leading up to the company’s purchase of structural quotas (1998-2007) and before the company was sold (2014-2018). In the latter of these two periods, 100% or more of the annual profit was distributed as dividends. The company had profitability (see Appendix 2d) and liquidity (refer to Appendix 1d) to support these substantial dividend distributions. There was no need to retain large cash reserves in a balance sheet that wasn’t actively invested in. Therefore, it is likely that these funds could yield a higher economic return outside the company than within it.
Findings in response to Research Question 2
The second research question, along with its subsequent subquestions, was formulated as follows:
- RQ 2: How did the operational performance of the exiting firm compare to the industry average in the years leading up to the exit from the industry?
- RQ 2a: Did EF have higher or lower profitability than AF?
- RQ 2b: Did EF operate more or less efficiently than AF?
Comparative analysis of revenues, profitability, and operational efficiency
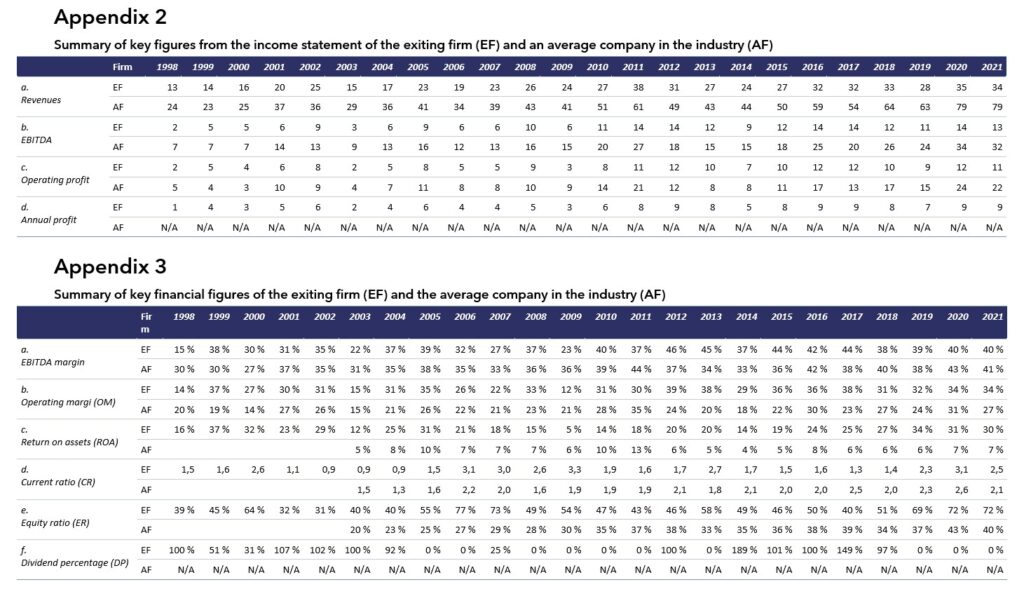
Appendix 2 presents a compilation of key financial metrics from the income statements of EF and AF spanning the study period, while Appendix 3 contains economic key ratios.
The rise in nominal annual revenues during the analysis period is primarily influenced by increased prices for pelagic products (see Figure 1), annual variations in the catch volume of various pelagic species, and currency exchange rate fluctuations. The Norwegian Krone has in recent years experienced a depreciation relative to the USD and EUR. It is reasonable to assume that EF and AF have been similarly affected by these changes.
Nonetheless, the revenue growth (Appendix 2a) of EF (+156%) has been significantly less than for AF (+230%). This is likely related to the fact that the quota holdings have grown less for the former vessel than the average vessel over the period (Appendix 1a).
Regarding RQ 2a (Profitability)
At the beginning of the period (1998), EF’s operating profit (Appendix 2c) was 2 MNOK compared to AF’s 5 MNOK, constituting 40%. By the end of the period (2021), this proportion had increased to 50%, even though the absolute gap had expanded to 11 MNOK. AF has more significant depreciations than EF (Appendix 2b minus Appendix 2c) due to more extensive investments in time-limited quotas (Appendix 1a) and vessels (Appendix 1b).
Despite EF’s lower revenue growth compared to AF (+156% vs. +230%) and its relatively smaller quota holdings, EF maintained a competitive level of profitability. While its absolute operating profit was consistently lower than AF’s throughout the study period, the proportionate gap narrowed. Moreover, EF’s operating margin averaged 30%, surpassing AF’s 23%, indicating that EF managed to maintain strong profitability despite its smaller scale and fewer investments in quota and vessels.
Regarding RQ 2b (Operational efficiency)
Even though EF’s vessel appears outdated throughout the analysis period and the firm’s relatively small quota holding, it has operated with remarkable operational efficiency. This is reflected in its EBITDA margin, which on average was as large as AF’s (i.e., 36%, see Appendix 3a) and in its operating margin (refer to Appendix 2c), which averaged 30% in the study period compared to 23% for AF. The ability to sustain such efficiency suggests that EF effectively optimized its operations, countering the assumption that exiting firms necessarily operate less efficiently than industry averages.
Findings in response to Research Question 3
Below, I present the third and final research question of this study:
RQ 3: Which factors may have influenced the timing of the exit?
Since this study relies solely on publicly available information, Table 5 provides detailed information about the case firms, their names are, however, anonymized.
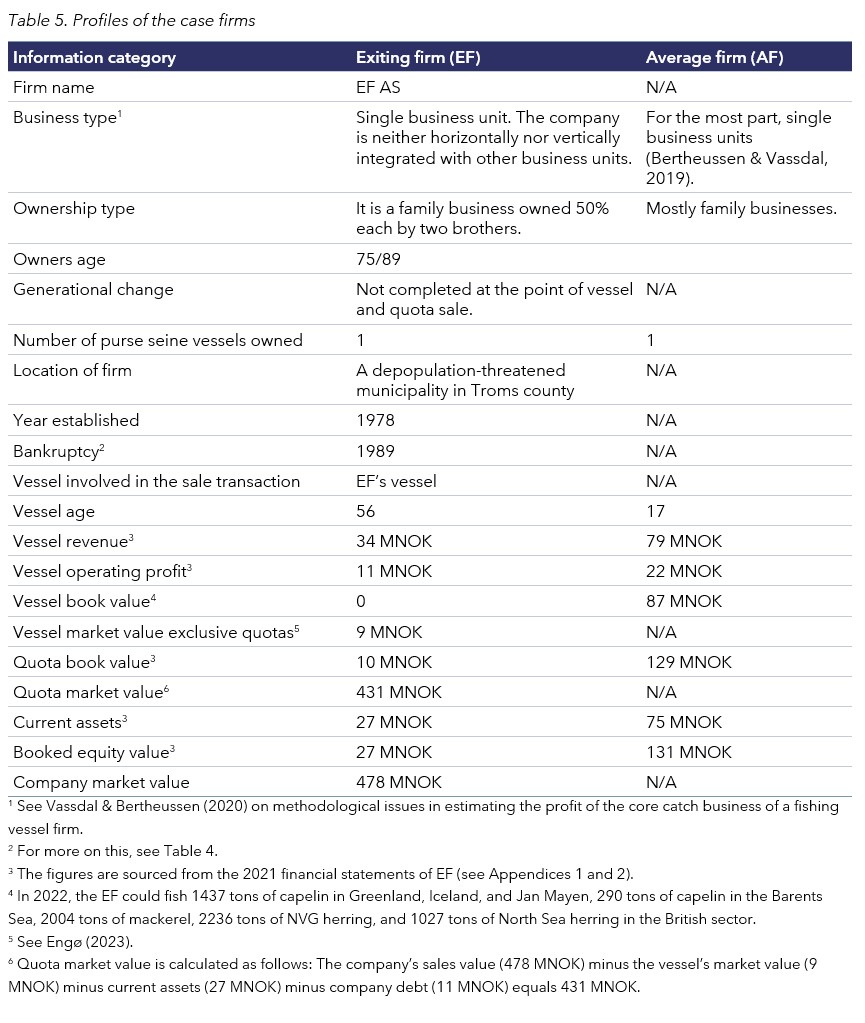
Table 5 underscores significant variations in the historical contexts between the EF and AF firms, notably emphasizing EF’s smaller-scale activities.
Regarding the timing of the exit decision, it is worth noting that the eldest shipowner had already exceeded the age limit for holding a commercial fishing quota, while the youngest had just reached this limit of 75 years. Moreover, the families had not carried out a generational transition. Additionally, the vessel was so old that it was due for replacement. It is likely that these three factors combined influenced the timing of the exit decision (also see Subchapter 7.5).
The state would have revoked the quota if the exit had been further delayed. According to rough calculations, this could have resulted in the shipowners losing a quota value of up to 431 MNOK in the worst-case scenario (see Table 5, Note 6).
Discussion
This study tracks the economic evolution of a small fishing vessel company in Norway participating in an ITQ-regulated fishery over 24 years until the company, including its quotas and an ancient vessel, was sold for a staggering amount compared to its book value (see Table 5). The study commences roughly around when Norwegian authorities permitted shipowners to trade fishing quotas, subject to certain regulatory constraints. To gain deeper insight into what differentiates a firm with an exit strategy from firms intending to continue their operations, the investment and financing behavior and economic performance of the case company (EF) are compared with the industry average firm (AF).
Investment and financing strategies
The first research question examined how the investment and financing strategies of the exiting firm differed from those of the average firm in the industry. Within commercial fishing, where products are highly sought-after and command premium prices, quotas emerge as a vessel’s principal revenue and profit driver (Bertheussen et al., 2020). EF exclusively fished on free quotas until 2008 (see Appendix 1a). However, in 2008, EF increased its quota holding by purchasing time-limited structural quotas for 30 MNOK. By the end of the study period, 2/3 of these quotas had been written down (see Appendix 1a). Conversely, AF’s recorded quota values experienced a 158% increase from 2008 to 2021, more than doubling its starting amount (see Appendix 1a). In summary, AF operated far more aggressively in the quota market than EF.
EF’s investments in the vessel were minimal throughout the analysis, as indicated in Appendix 1b. In contrast, AF’s vessel investments increased 72% during the same period, as shown in Appendix 1b. EF’s investments in other operational assets like fishing gear have been relatively minimal, particularly compared to AF, as detailed in Appendix 1c. However, despite minimal investments in vessel and gear, EF has effectively leveraged its quota basis to secure a stable and growing revenue stream, as evidenced in Appendix 2a.
One unique characteristic of the Norwegian quota market is that quotas and vessels are indivisible. Consequently, any transaction must include the associated vessel, which could result in considerable transaction costs for a buyer tasked with decommissioning the purchased vessel (Williamson, 1979). In this study, the seller mitigated these potential costs by forgoing investments in the ship over 24 years, thereby depreciating its value—and the associated transaction costs—to zero by the time of sale (see Appendix 1b).
As expected, the financing behaviors of EF and AF closely align with their respective investment strategies. EF’s conservative investment approach led the company to incur long-term debt only for its 2008 quota purchase (refer to Appendix 1i). In contrast, AF’s near doubling of its long-term debt signifies a more aggressive investment posture. Both companies experienced substantial and sustained increases in equity throughout the analysis period, indicative of the notable economic profitability during this time (also, see Bertheussen & Vassdal, 2023, 2022, 2021, 2019). Economically prosperous times are further accentuated by the considerable unrecorded values inherent in their quota holdings, which are received for free.
During the analysis period, EF distributed dividends totaling 79 million, averaging 3.3 MNOK per year and constituting 56% of annual profit. Dividend payouts were especially high before purchasing structural quotas and before the company’s sale, some years exceeding 100% of yearly profits. The firm’s profitability and liquidity were sufficient to support these substantial dividends, negating the need for large cash reserves given the lack of investments in the old vessel and moderate quota base. However, the quota investment made in 2008 was partly financed with paid-in equity of 13 MNOK (6 MNOK in 2005 and 7 MNOK in 2008) (see Appendix 1h).
Operational performance
The second research question posed in this study was about the operational performance of EF compared to AF in the years leading up to the industry exit.
In 1998, EF’s revenues were 11 MNOK less than AF’s, a gap that widened to 45 MNOK by 2021 (see Appendix 2a). The primary reason for this disparity is that EF has purchased relatively fewer structural quotas than the rest of the industry. Moreover, EF refrained from acquiring quotas to fish for other pelagic species, such as blue whiting. This might be attributed to the older vessel not being equipped for demanding fishing operations in the extremely harsh weather conditions found far west of Ireland, where blue whiting fishing occurs.
Despite the vessel appearing outdated throughout the analysis period, it has operated remarkably efficiently. This is reflecte d in its EBITDA and operating margins (refer to Appendix 3a and 3b). Over the 24-year analysis period, the EBITDA margin averaged 36%, the same as for AF. The average operating margin stood at 30%, significantly higher than the industry average of 23%. This is remarkable because AF operated with larger quotas and more modern vessels in the study period.
Due to these modern assets, the industry’s more significant depreciations reduced their operating margin. This point is further emphasized when considering the return on total assets (ROA), which was 7% for the industry and 30% for EF during the analysis period. AF’s ROA is weighed down by relatively higher recorded values of structural quotas (see Appendix 1a), higher recorded vessel values (refer to Appendix 1b), and also the higher value of fishing gear investments (refer to Appendix 1c).
Despite fishing with a relatively small quota and using an old and seemingly outdated vessel unable to reap scale and scope economics (i.e., fishing blue whiting), EF performs at least as well as AF in key financial metrics during the study period (see Appendix 3). This result is surprising and does not support the theoretical hypothesis that the least efficient vessels are the ones that will exit an ITQ-regulated fishery in favor of more efficient vessels, thus increasing the overall efficiency of the industry. This finding supports Nøstbakken’s (2012) claim that the efficiency gains theoretically expected to benefit the sector due to transferable quotas may not necessarily be realized in practice.
Timing of the exit
The timing of an exit decision can be influenced by numerous economic and non-economic factors (Nøstbakken, 2012). Buyers and sellers may hold different expectations about the future (Barney, 1986), for instance, regarding stock development, market conditions, regulatory uncertainty surrounding the structural quota system (such as reversion and quota ceilings), or other unpredictable factors.
At the time of the exit decision, it may be difficult to determine whether the timing of the sale was economically optimal. For example, could the company have achieved a higher return on capital if it had sold its entire quota at that point instead of purchasing structural quotas in 2008 and investing the proceeds in a global investment fund?
However, it is equally plausible that the timing was driven by non-economic factors, such as the fact that both shipowners were of advanced age at the time of the sale. Perhaps they were compelled to sell because no individual can own a Norwegian fishing quota beyond the age of 75 without risking it being confiscated by the state without compensation. This regulatory constraint and the possibility that no heirs were interested in taking over the company may have played a decisive role.
For the heirs, inheriting a significant financial sum might have been more attractive than taking over an outdated purse seiner despite its valuable fishing quota. If a pair of siblings wished to continue operating the company, they would have to obtain substantial loans to buy out the other siblings (Bertheussen et al., 2021; Iversen et al., 2018). It is, therefore, possible that none of the heirs had the desire nor the financial capacity to take over the business (Bertheussen et al., 2021).
Not only were the owners of advanced age at the time of sale but so was the vessel. It was 56 years old compared to the average vessel age of 17 (see Table 5). According to the Norwegian Maritime Authority (2015) (in Norwegian: Sjøfartsdirektoratet), a vessel is expected to have an economic lifespan of several decades before wear and the need for expensive repairs render further operation uneconomical. Furthermore, the National Audit Office (NAO, 2020) suggests that the average age of a vessel in the purse seine group ranges between 13 and 18 years.
Implications
The present study challenges several theoretical assumptions and adds nuance to our understanding of ITQ-regulated fisheries’ operation. Contrary to the theoretical expectation that less efficient vessels will exit the industry in favor of more efficient ones (e.g., see Arnason, 2008; Grafton, 1996), the study found that the exiting firm was at least as efficient as the average firm. This suggests that efficiency is not the sole driver for exiting an ITQ-regulated industry. Factors like the age of owners and vessels, family ownership, geographical location, and cluster affiliation can also play a significant role (Nøstbakken, 2012), a finding that adds complexity to economic models that often assume rational, profit-maximizing behaving actors.
This study offers several managerial implications for firms operating in ITQ-regulated fisheries and similar industries. The study shows that even a firm with an older, depreciated asset can stay profitable and capture substantial accumulated resource rent upon exiting the industry. This suggests that fishing vessel firms should consider long-term exit strategies, including asset depreciation schedules, as part of their business planning.
The case company in the present study could distribute substantial dividends without jeopardizing its operational efficiency or exit strategy. Thus, managers should consider how dividend policies can align with their long-term business goals. Managers need to be acutely aware of regulatory constraints, including those that might make transferring the business to the next generation challenging. This could influence both daily operations and long-term strategies. The study highlights the importance of effectively managing tangible and intangible assets like quotas. For example, the case company operated efficiently despite having an older vessel, partly because it managed its quota assets so effectively.
Limitations
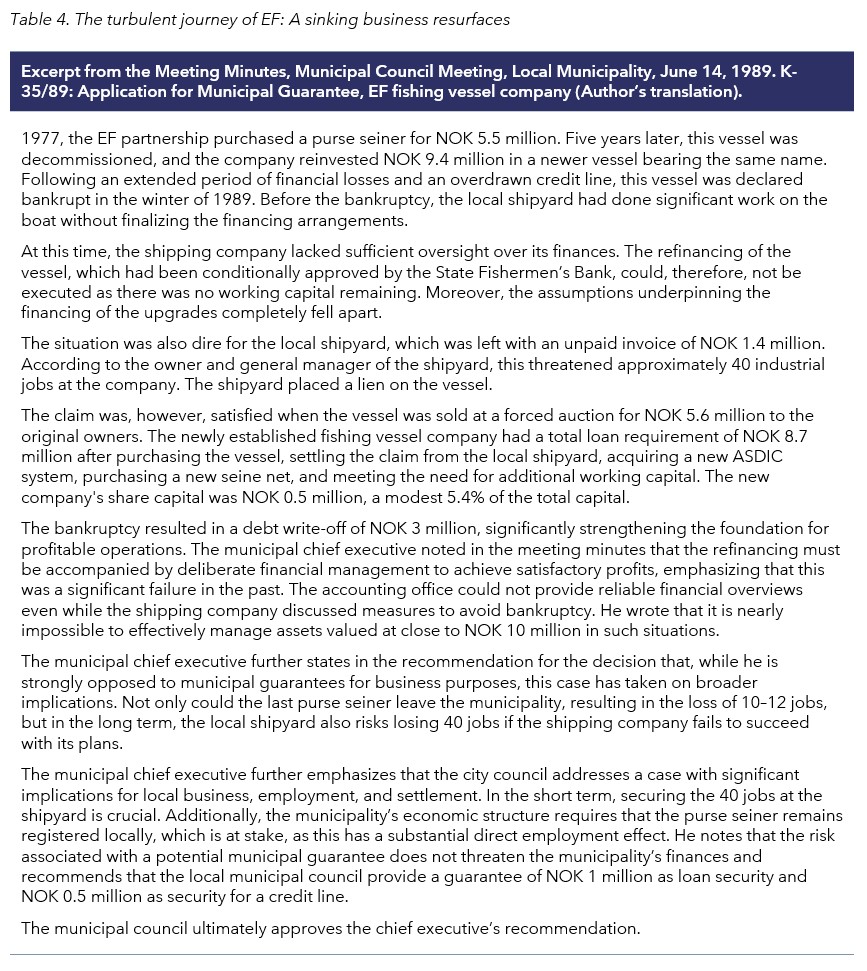
In this study, the unit of analysis is a fishing vessel, and my focus has been on the strategic maneuvers undertaken by the vessel’s owners to maximize their wealth. However, other perspectives might be equally intriguing for future research endeavors. Fisheries often play a significant role in local economies. Regulations in Norwegian fishery policy frequently reflect social considerations, striving to harmonize the economic advantages of fishing with the necessity to safeguard the well-being of fishing communities and to guarantee the sustainable utilization of fishery resources (NAO, 2020; Soliman, 2014). Future studies on exit strategies can elaborate on the socioeconomic impact on communities when participants leave the fishery, including effects on employment, local income, and social structure (Edvardsson et al., 2018; Olson, 2011). The exit firm in this case study would hardly have been able to reestablish itself without the municipality’s active involvement in the bankruptcy in 1989 (see Table 4).
Due to the inability to conduct interviews, this study faces limitations in understanding buyers’ and sellers’ motivations behind quota trading. A common issue in this sector, highlighted by Nøstbakken (2012), involves the continuity of shipping companies within families as founders near retirement. This challenge stems from substantial quota values being tied up within the company. In scenarios involving several heirs, there may be a divide between those wanting to maintain the company and those inclined to cash out their shares. Such situations require considerable financial means to facilitate the buyout of some stakeholders in a highly valued shipping enterprise.
Whether the company owners’ exit strategy was a long-considered plan or a decision influenced by impending retirement remains ambiguous. This lack of clarity arises from the owners’ preference for keeping details of their quota transactions private. Lastly, caution is advised when attempting to extrapolate findings from this singular case study to broader contexts.
The empirical analysis demonstrates that neither weak profitability nor inefficiency in relation to other actors within the same industry can explain the case firm’s strategic decision to exit the ITQ-based industry. However, whether this finding is context-dependent or more general remains an open question. The economic dynamics of an ITQ-based industry are distinct, as quotas constitute a significant portion of a firm’s value, and ownership structures and regulatory frameworks constrain the decision-making options for buyers and sellers. This may make exit decisions less dependent on traditional economic factors such as profitability and efficiency.
Nevertheless, factors such as family ownership, regulatory regimes, and the value of intangible assets like quotas may also be relevant in other industries with high exit barriers. Against this backdrop, I will emphasize the need for further studies that examine exit strategies in different contexts, for example, by comparing the fisheries sector with other capital-intensive industries where similar or alternative mechanisms may drive exit decisions.
Furthermore, both national and international fisheries management measures have the potential to shape exit patterns. For example, uncertainty surrounding quota systems, reversion rules for quotas, and other political changes can incentivize early or delayed exit. These are factors that should receive greater attention in future research.
Acknowledgments
I want to express my sincere gratitude to the anonymous reviewer for providing insightful and constructive feedback, which has significantly improved this paper. Their thoughtful comments and suggestions have helped refine the analysis and strengthen the theoretical contributions. I also appreciate their encouragement to explore additional perspectives, particularly regarding the strategic timing of exit decisions. Finally, I sincerely appreciate the editor’s professional and prompt handling of my paper submission.
References
- Abe, K., Nøstbakken, L. & Wold, M.F. (2023). Quota consolidation in Norwegian coastal fisheries. SNF Working Paper No. 05/23. Centre for applied research at NHH.
- Arnason, R. (2008). Iceland’s ITQ system creates new wealth. The electronic journal of sustainable development, 1:2, 35–41.
- Arntzen, S.K. (2023). Kvotesystemet 2022. En rettslig analyse av kvotesystemet i de ervervsmessige saltvannsfiskeriene [Quota System 2022: A Legal Analysis of the Quota System in Commercial Saltwater Fisheries]. Oslo: Universitetsforlaget.
- Asche, F., Garlock, T.M., Anderson, J.L., Bush, S.R., Smith, M.D., Anderson, C.M., … & Vannuccini, S. (2018). Three pillars of sustainability in fisheries. Proceedings of the National Academy of Sciences, 115:44, 11221–11225.
- Barney, J.B. (1986). Strategic factor markets: Expectations, luck, and business strategy. Management Science, 32:10, 1231–1241.
- Bertheussen, B.A. (2023). Perspectives on Rent Generation and Rent Appropriation in Fisheries. Arctic Review on Law and Politics, 14, 4–20.
- Bertheussen, B.A. (2022a). The role of path-dependent institutions during the collapse and rebuilding of a fishery. Marine Policy, 136, 104944.
- Bertheussen, B.A. (2022b). Gjenoppbygginga og omfordelinga av inntekter etter den store sildekollapsen. Økonomisk fiskeriforskning: Ledelse, marked, økonomi, 32:1, 14–33.
- Bertheussen, B.A. (2021). Sustained competitive advantage based on industry-specific institutional frameworks. Frontiers in Marine Science, 8, 697936.
- Bertheussen, B.A. & Vassdal, T. (2023). Appropriation of economic values in a rights-based fishery. Ocean & Coastal Management, 237, 106537.
- Bertheussen, B.A. & Vassdal, T. (2022). Rent generation under the Norwegian rights-based pelagic fishery. Frontiers in Marine Science, 9, 841505.
- Bertheussen, B.A. & Vassdal, T. (2021). Institution-based roots to fishing vessels profitability. Marine Policy, 123, 104286.
- Bertheussen, B.A., & Vassdal, T. (2019). Strategic sources of superprofit in a well-regulated fishery. Marine Policy, 106, 103551.
- Bertheussen, B.A., Dreyer, B.M., Hermansen, Ø. & Isaksen, J.R. (2021). Institutional and financial entry barriers in a fishery. Marine Policy, 123, 104303.
- Bertheussen, B.A., Dreyer, B.M., Dreyer, S. & Evenseth, S. (2020). Performance differences between nations exploiting a common natural resource: The Icelandic–Norwegian mackerel case. Marine Policy, 122, 104269.
- Bertheussen, B.A., Xie, J. & Vassdal, T. (2020). Strategic investments in catch capacity and quotas: How costly is a mismatch for a firm? Marine Policy, 117, 103874.
- Chirico, F., Gómez-Mejia, L.R., Hellerstedt, K., Withers, M. & Nordqvist, M. (2020). To merge, sell, or liquidate? Socioemotional wealth, family control, and the choice of business exit. Journal of Management, 46:8, 1342–1379.
- DeTienne, D.R. & Chirico, F. (2013). Exit strategies in family firms: How socioemotional wealth drives the threshold of performance. Entrepreneurship Theory and Practice, 37:6, 1297–1318.
- Dreyer, B., & Grønhaug, K. (2004). Uncertainty, flexibility, and sustained competitive advantage. Journal of Business Research, 57:5, 484–494.
- Edvardsson, K.N., Păstrăv, C. & Benediktsson, K. (2018). Mapping the geographical consolidation of fishing activities in Iceland during the maturation of the ITQ fisheries management system. Applied geography, 97, 85–97.
- Engø, T. (2023). Snurper strippet for kvoter til salgs for småpenger [Purse Seiner Stripped of Quotas for Sale at a Bargain Price], Kystmagasinet: https://www.kystmagasinet.no/brukt-fartoy-skipsmegler-snurper-/-trawler/snurper-strippet-for-kvoter-til-salgs-for-smapenger/1543446
- Engø, T. (2022). Ble solgt for flere hundre millioner [Sold for Several Hundred Million], Kystmagasinet: https://www.kystmagasinet.no/brukt-bat-kvoter-kvotesalg/ble-solgt-for-flere-hundre- millioner/1122677
- Flaaten, O., Heen, K. & Matthíasson, T. (2017). Profit and resource rent in fisheries. Marine Resource Economics, 32:3, 311–328.
- Flaaten, O. (2021). The rise and decline of fishing industry support–with a translation from Norwegian of Bjørn S. Brochmann’s 1981 article ‘long-term effects of government support to the fisheries’. Marine Policy, 126, 104112.
- Gilding, M., Gregory, S. & Cosson, B. (2015). Motives and outcomes in family business succession planning. Entrepreneurship Theory and Practice, 39:2, 299–312.
- Grafton, R.Q. (2005). Social capital and fisheries governance. Ocean & Coastal Management, 48:9-10, 753–766.
- Grafton, R.Q. (1996). Individual transferable quotas: theory and practice. Reviews in Fish Biology and Fisheries, 6, 5–20.
- Grafton, R.Q., Arnason, R., Bjørndal, T., Campbell, D., Campbell, H.F., Clark, C.W., … & Weninger, Q. (2006). Incentive-based approaches to sustainable fisheries. Canadian Journal of Fisheries and Aquatic Sciences, 63:3, 699–710.
- Hannesson, R. (2013). Norway’s experience with ITQs. Marine Policy, 37, 264–269.
- Hannevig, H. & Bertheussen, B.A. (2020). The exploitation-exploration dilemma of fishing vessels with institutionally protected quota shares. Frontiers in Marine Science, 7, 436.
- Hersoug, B., Finstad, B.P., & Christensen, P. (2015). The system of Norwegian fish sales unions–An anachronism or a successful adaptation to modern fisheries? Acta Borealia, 32:2, 190–204.
- Hersoug, B. (2005). Closing the Commons: Norwegian Fisheries from Open Access to Private Property. Eburon Uitgeverij B.V.
- Hsu, D.K., Wiklund, J., Anderson, S.E. & Coffey, B.S. (2016). Entrepreneurial exit intentions and the business-family interface. Journal of Business Venturing, 31:6, 613–627.
- Isaksen, J.R. (2007). Upstream vertical integration and financial performance: the case of the Norwegian fish processing industry, Ph. D. thesis, Tromsø: Norwegian College of Fishery Science, University of Tromsø.
- Iversen, A., Isaksen, J.R., Hermansen, Ø., Henriksen, E., Nyrud, T., & Dreyer, B. (2018). Strukturering i fiskeflåten-Drivkrefter og konsekvenser. Rapport 8/2018, Nofima, Tromsø.
- NAO (National Audit Office) (2020). Riksrevisjonens undersøkelse av kvotesystemet i kyst- og havfisket [The Investigation of the National Audit Office of the Quota System in Coastal and Marine Fisheries]. Riksrevisjonen: Dokument 3:6 (2019–2020).
- North, D.C. (1990). Institutions, institutional change, and economic performance. Cambridge: Cambridge University Press.
- Norwegian Directorate of Fisheries (2023). Kvotefaktorer og strukturgevinst, andre fartøygrupper [Quota Factors and Structural Gains, Other Vessel Groups]:https://www.fiskeridir.no/Yrkesfiske/Tall-og-analyse/Fangst-og-kvoter/kvotefaktorer-strukturkvoter-og-strukturgevinst/kvotefaktorer-og-strukturgevinst-andre-fartoygrupper
- Norwegian Directorate of Fisheries (2022). Fartøygrupper, 2003-2021, Ringnotsnurpere, [Vessel Groups, 2003-2021, Purse Seiners]: https://www.fiskeridir.no/Yrkesfiske/Tall-og-analyse/Loennsomhet/Tidsserier
- Norwegian Directorate of Fisheries, Profitability survey (n.d.): About the Statistics – Profitability in the Fishing Fleet: https://www.fiskeridir.no/English/Fisheries/Statistics/Profitability-survey-of-the-fishing-fleet
- Norwegian Maritime Authority (2015). Opphugging av skip: fakta om skipsopphugging [Ship Scrapping: Facts About Ship dismantling] https://www.sdir.no/sjofart/fartoy/miljo/opphugging-av-skip/
- Nøstbakken, L. (2012). Investment drivers in a fishery with tradable quotas. Land Economics, 88:2, 400–424.
- Nøstbakken, L., Thébaud, O. & Sørensen, L.C. (2011). Investment behaviour and capacity adjustment in fisheries: a survey of the literature. Marine Resource Economics, 26:2, 95–117.
- Olson, J. (2011). Understanding and contextualizing social impacts from the privatization of fisheries: An overview. Ocean & Coastal Management, 54:5, 353–363.
- Ostrom, E. (1990). Governing the commons: The evolution of institutions for collective action. Cambridge: Cambridge University Press.
- Park, H. & Jang, H. (2009). Fishery Exit Model under Individual Transferable Quota System: An Inquiry into the Economic Efficiency Achievement in Fishery. Environmental and Resource Economics Review, 18:1, 1–22.
- Pascoe, S., Giles, N. & Coglan, L. (2019). Extracting fishery economic performance information from quota trading data. Marine Policy, 102, 61–67.
- Peng, M.W., Sun, S.L., Pinkham, B. & Chen, H. (2009). The institution-based view as a third leg for a strategy tripod. Academy of management perspectives, 23:3, 63–81.
- Porter, M.E. (2008). The five competitive forces that shape strategy. Harv. Bus. Rev. 86, 25–40.
- Porter, M.E. (1980). Competitive Strategy: Techniques For Analysing Industries And Competitors. New York: Free Press.
- Soliman, A. (2014). Using individual transferable quotas (ITQs) to achieve social policy objectives: A proposed intervention. Marine Policy, 45, 76–81.
- Symeonidou, N., DeTienne, D.R. & Chirico, F. (2022). The persistence of family firms: How does performance threshold affect family firm exit? Small Business Economics, 59:2, 477–489.
- Vassdal, T. & Bertheussen, B.A. (2020). Methodological issues in estimating the profit of the core catch business unit of a fishing vessel firm. MethodsX, 7, 100990.
- Vatn, A. (2007). Institutions and the Environment. Edward Elgar Publishing.
- Vestergaard, N., Jensen, F. & Jørgensen, H.P. (2005). Sunk cost and entry-exit decisions under individual transferable quotas: why industry restructuring is delayed. Land Economics, 81:3, 363–378.
- Williamson, O.E. (1979). Transaction-cost economics: the governance of contractual relations. The Journal of Law and Economics, 22:2, 233–261.
- Wisth, A.W., & Sivertsen, V. (2023). Fartøy eller kvoter: Hva skaper verdi? [Vessels or Quotas: What Creates Value?]. Master Thesis, UiT School of Business and Economics, UiT The Arctic University of Norway.